Research has shown a strong relationship between student engagement and a variety of student success outcomes (e.g., Fredricks et al.,2004; Parsons et al., 2013). For example, Finn and Rock (1997) found that low-income minority students who were observed as engaged, were more likely to be academically successful, achieve passing grades, and graduate on time. Similarly, a study conducted by Guthrie, Wigfield et al. (2004) found that increased levels of student engagement were related to increased reading achievement. In general, student engagement impacts student achievement, regardless of the content of the course or the demographic characteristics of the student (Marks, 2000). Student engagement matters.
Measuring Student Engagement
The AdvancED Student Engagement Survey was designed to measure elementary, middle and high school student engagement through students’ responses to items about their learning experiences. The survey delves deeply into the student experience and provides additional information and actionable data to improve teaching and learning. Unlike other approaches that are focused on the adults in the building, we focus on student engagement from the perspective of the learner. This cutting edge approach to gauging student engagement provides an opportunity for schools and systems to more deeply understand not only simply whether students are engaged or disengaged but also how and in what ways they do so.
The survey consists of 20 items categorized into three components or domains of engagement: behavioral, cognitive and emotional (Fredricks et al., 2004). Behavioral engagement refers to a student’s efforts in the classroom, while cognitive engagement examines a student’s investment in learning, and emotional engagement measures a student’s emotions or feelings about the classroom and school, in general. Each of the domains is further broken down into three categories of engagement quality – committed, compliant and disengaged. Finally, each category consists of two distinct levels. Thus, the committed category has an “invested” or “immersed” level; the compliant category has a “strategic” or “ritual” level; and the disengaged category has a “retreatism” or “rebellion” level.
The survey is available in three forms – one for elementary (grades 3-5), middle (grades 6-8), and high school (grades 9-12) students, each with similar content adapted for the age group taking the survey. As such, each version has different characteristics psychometrically and must be considered individually when scoring. Pilot testing provided evidence that each version of the tool has both reliability and validity. (For a summary of the psychometric properties of the AdvancED Student Engagement Survey, click here).
Engagement Survey Results
In general, results are categorized by engagement type and quality of engagement. Survey results provide a useful summary of the detailed information represented in students’ responses and also provides information relative to a benchmark. A respondent who finishes the survey is labeled as “Committed,” “Compliant,” or “Disengaged” across each of the three domains. This label is based on which component of engagement the respondent answers the majority of the time within each domain. It should be noted that the Behavioral domain has six items which means it is possible that a respondent has an even number of responses across two or more components. In these cases, the respondent is labeled as having a “mixed” engagement type.
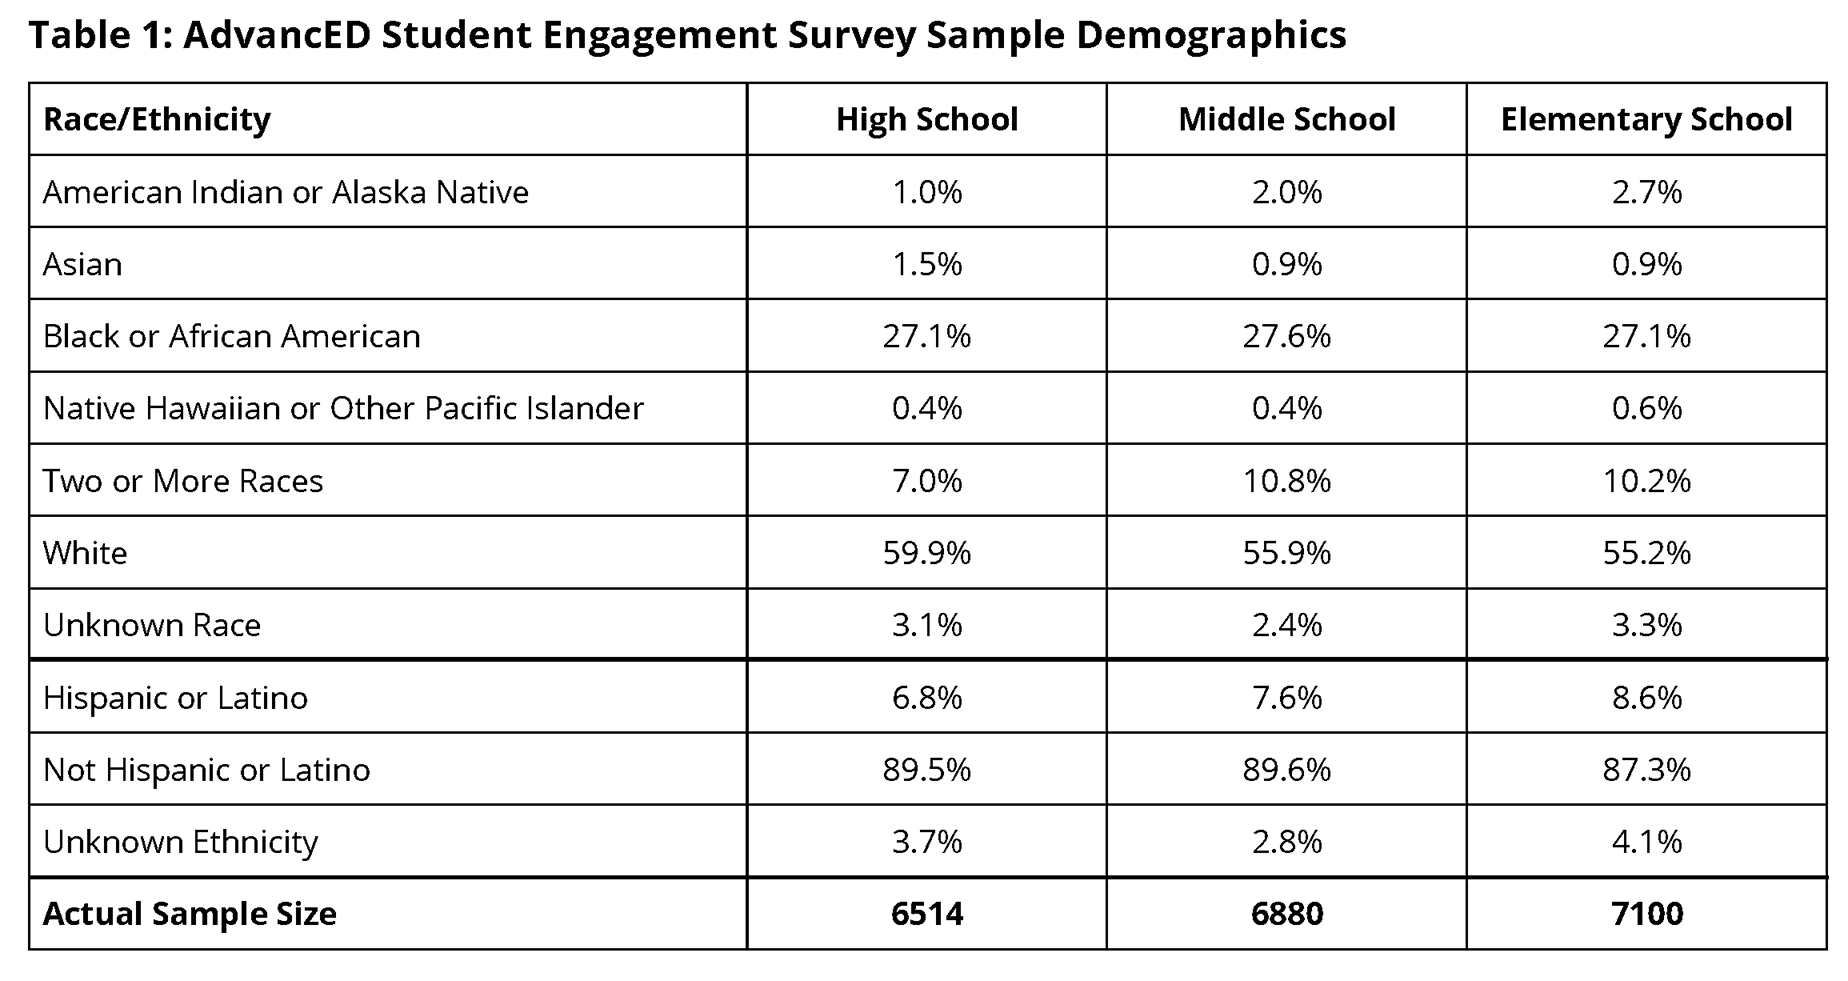
In spring 2017, AdvancED conducted a pilot study of the AdvancED Student Engagement Survey in Alabama, North Dakota and South Carolina using a purposeful randomized sampling frame based on the school-level characteristics representative of each state. While the instrument will be mostly used at the school, district and state level, this article summarizes the results of the pilot test at the individual student level aggregated across all sites. The sample consisted of 7,100 elementary, 6,880 middle, and 6,514 high school students with a total of 20,494 students. Table 1 provides the racial and ethnic breakdown of the sample.
The percentage reported for each domain was calculated by counting the number of respondents in each domain out of the total number of respondents taking part in the survey. The percentage reported for each component of engagement was calculated in the same way.
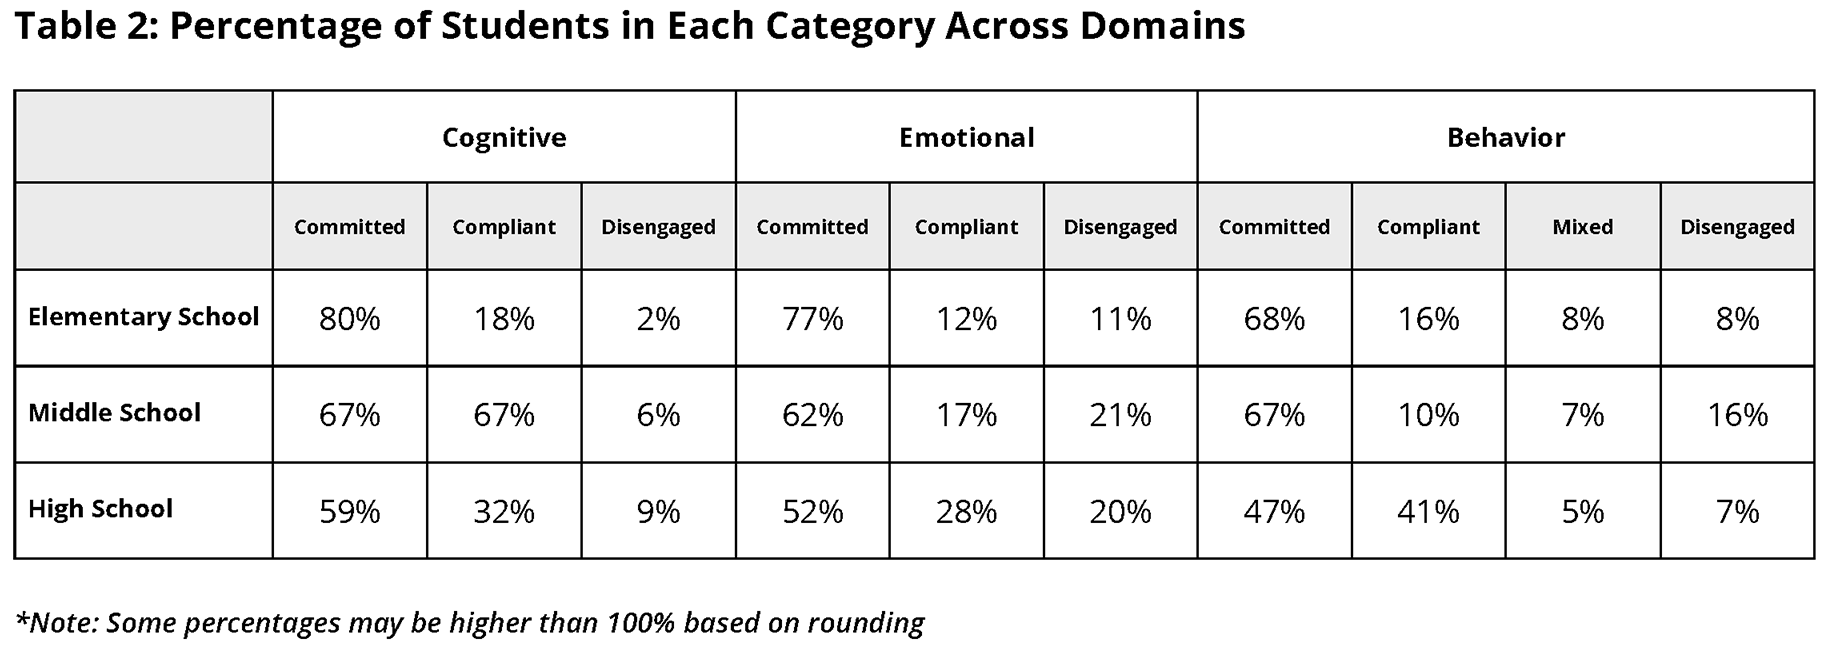
Overall, the majority of students at all grade levels were in the “Committed” category across all domains. Table 2 shows a summary of the results. However, as students went from elementary to middle to high school there was a decrease in the percentage of students in the “Committed” category across all 3 domains, with the biggest drop, 25 percent, between elementary and high school respondents in the Emotional domain.
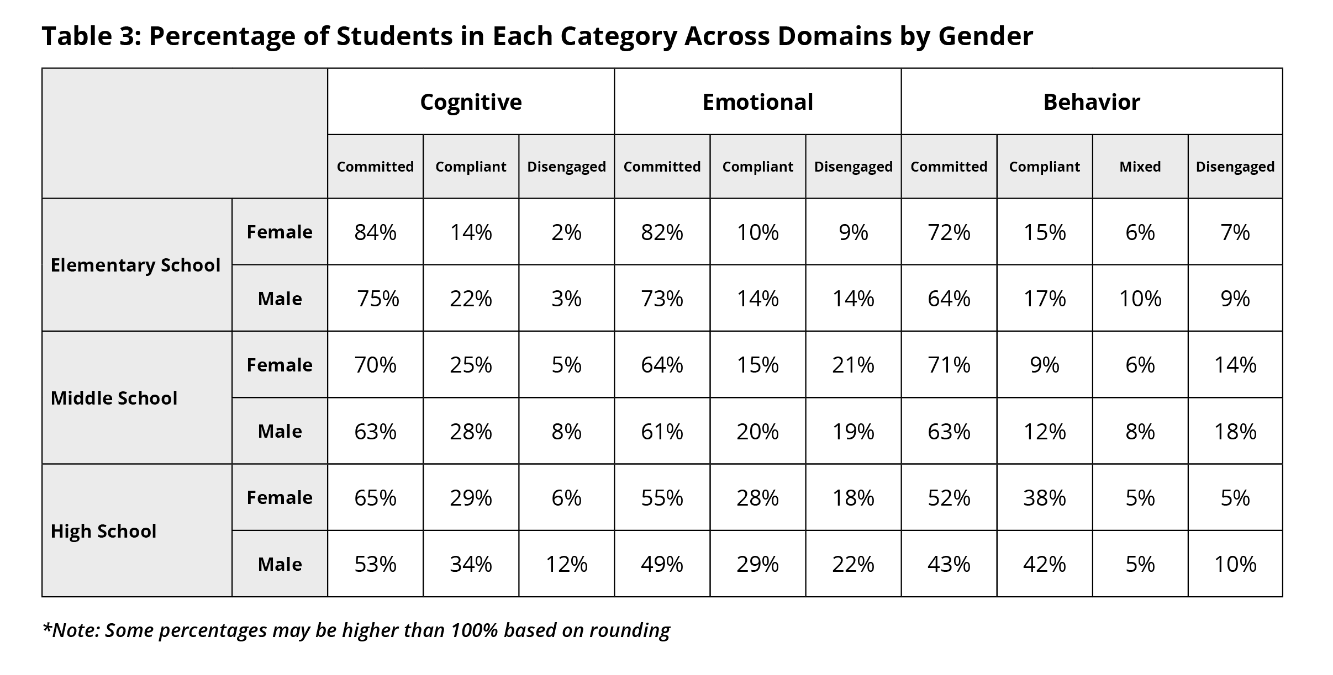
In general, there were no significant differences in the percentage of students within each category across domains when looking at race and ethnicity. At the same time, there were significant differences based on gender across all of the different school levels, as shown in Table 3. Note that the same pattern of a lower percentage of students in the Committed domain is present in these results as well.
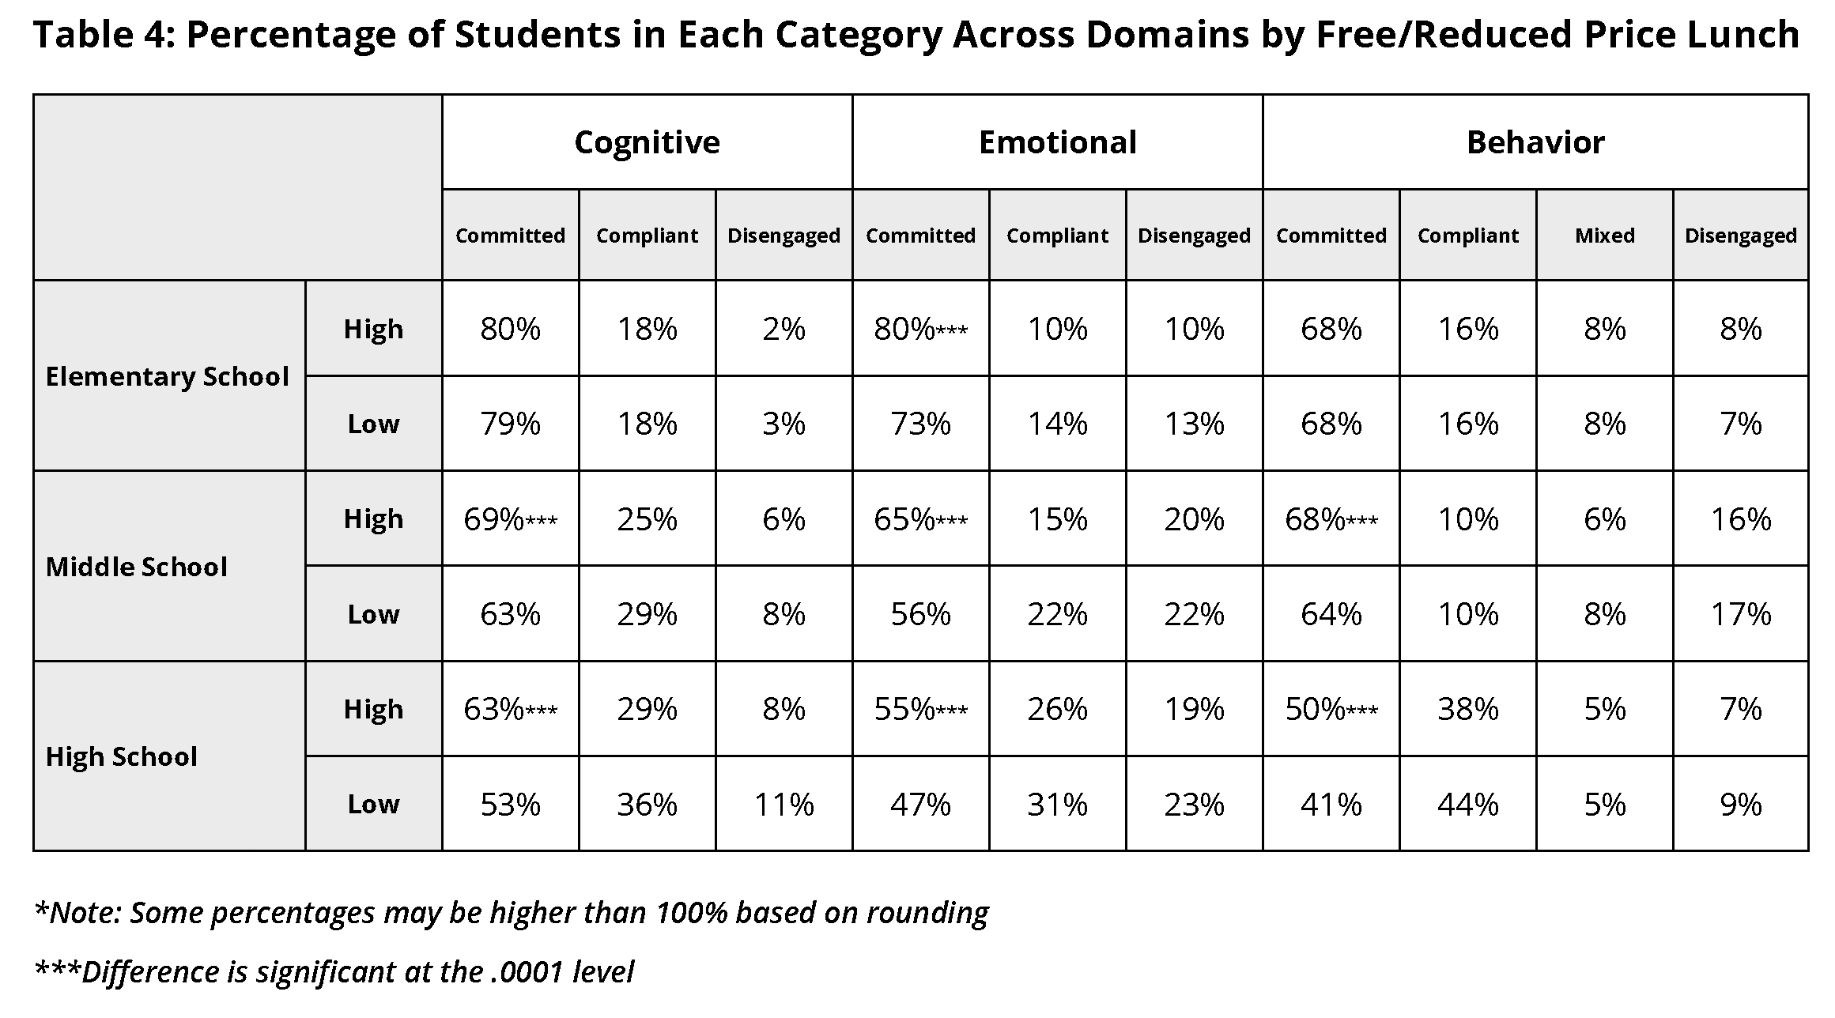
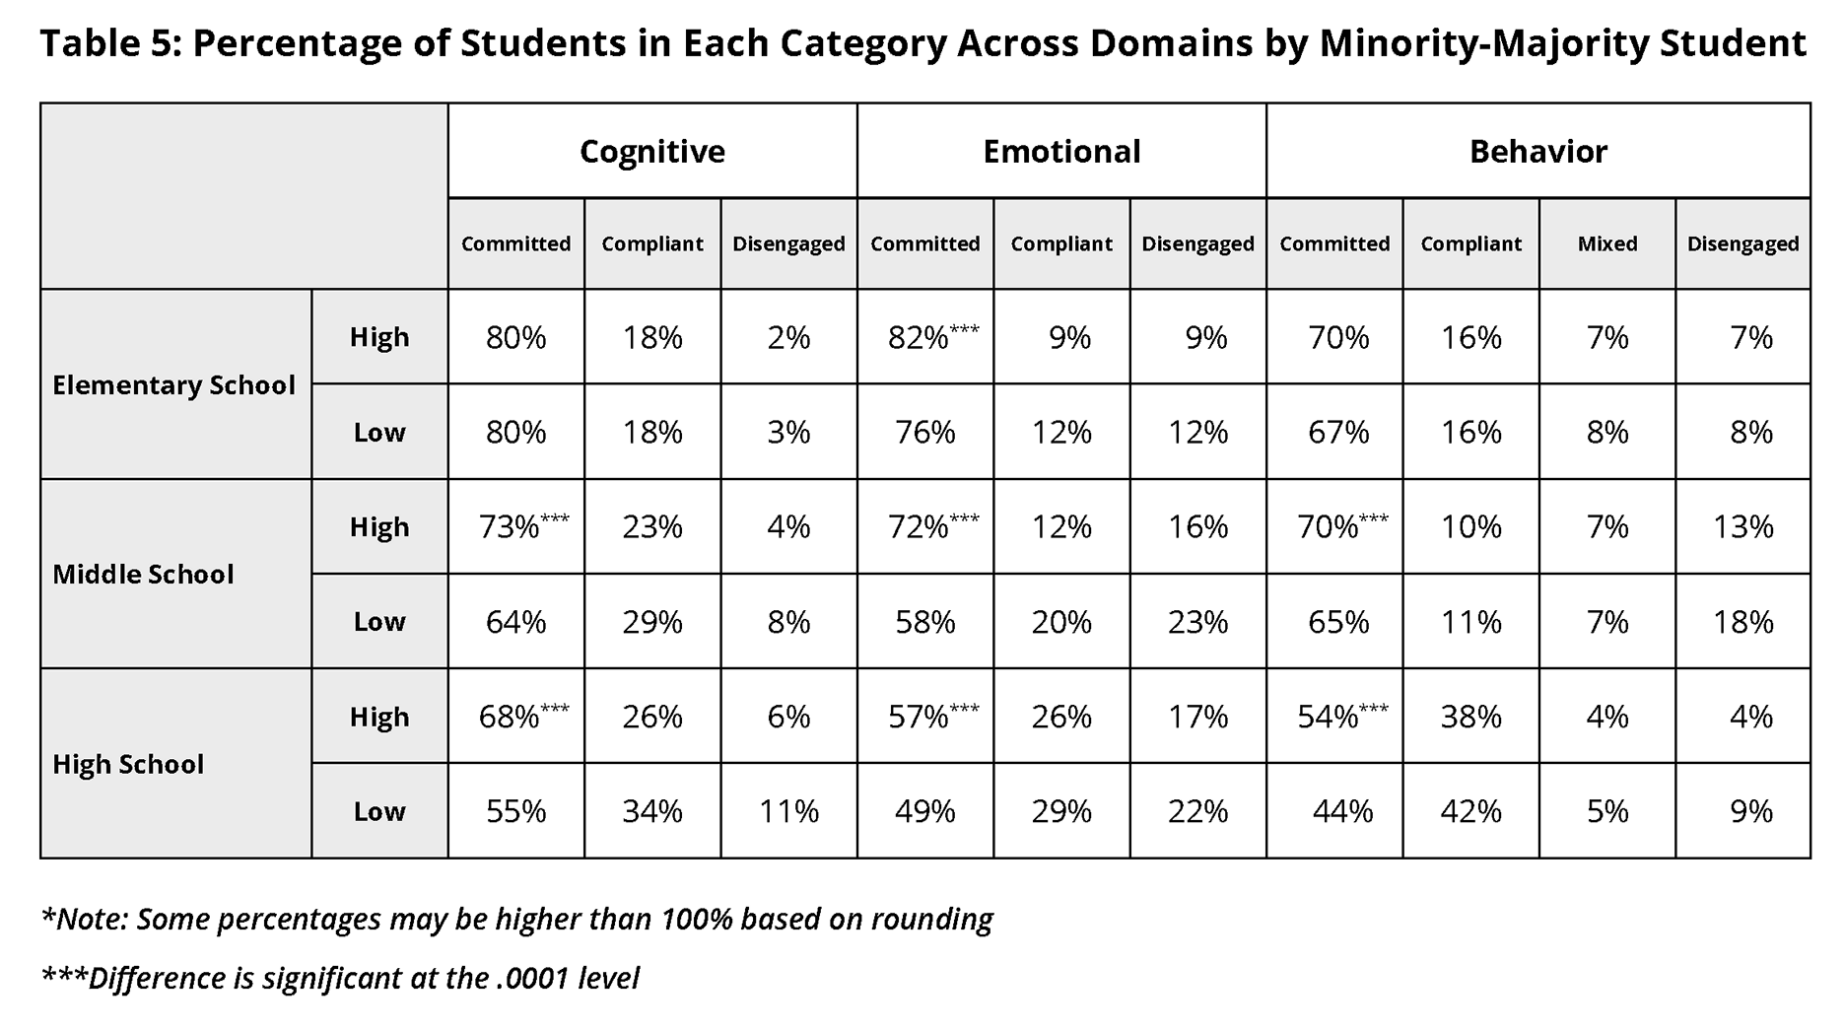
We also examined differences in the percentage of students in each category for high and low levels of students eligible for Free and/or Reduced Price Lunch (Table 4), as well as schools where minority students were the majority population of that school (Table 5). As above, the percentage of students who were in the Committed category shrunk as the students aged. In addition, there were some significant differences between groups within each domain. Notably, Cognitive, Emotional and Behavioral commitment at both the high and middle school level was significantly higher in schools with a greater percent students eligible for Free/Reduced Price Lunch.
Similarly, at middle and high schools with higher numbers of minority students, significantly higher percentages of students reported Cognitive, Emotional and Behavioral commitment than their peers who attended schools with fewer minority students.
In general, students reported diminishing overall engagement across all three domains as they got older. This pattern has been seen in other studies of student engagement, such as a study conducted by Gallup in 2013. While the reasons for this are beyond the scope of this review, AdvancED in future research will continue to investigate and identify best practices contributing to the higher student engagement levels in schools with high minority and free/reduced price lunch eligibility as well as why there is less engagement as student’s progress through their schooling using data gathered from the more than 34,000 schools that are part of the AdvancED Improvement Network.
Keeping students engaged in classrooms is a key component of effective teaching and learning. The more educators know about the level of engagement of their students, the greater educators’ ability to address potential problem areas. The AdvancED Student Engagement Survey, along with other eProve™ tools such as the Effective Learning Environments Observation Tool®(eleot®), the AdvancED Climate/Culture Surveys, Student and Teacher Inventories, and the School Quality Factors Diagnostic, provide needed data to create a roadmap for this crucial part of the improvement journey.
Finn, J. D., & Rock, D. A. (1997). Academic success among students at risk for school failure. Journal of Applied Psychology, 82(2), 221-234.
Fredricks, J.A., Blumenfeld, P.C., & Paris, A.H. (2004). School engagement: Potential of the concept, state of the evidence. Review of Educational Research, 74(1), 59-109.
Marks, H.M.(2000). Student engagement in instructional activity: Patterns in the elementary, middle, and high school years. American Educational Research Journal, 37(1), 153-184.
Parsons, S.A., Nuland, L.R., & Parsons, A.W. (2014). The ABC’s of student engagement. The Phi Delta Kappan, 95(8), 23-27.
Note:
Click here to review the psychometric properties of the AdvancED Student Engagement Survey.
© Cognia Inc.
This article may be republished or reproduced in accordance with The Source Copyright Policy.
The information in this article is given to the reader with the understanding that neither the author nor Cognia is in engaged in rendering any legal or business advice to the user or general public. The views, thoughts, and opinions expressed in this article belong solely to the author(s), and do not necessarily reflect the official policy or position of Cognia, the author’s employer, organization, or other group or individual.
