States collect and publicly report more education data than ever before. Assessment results, student growth, graduation rates, chronic absenteeism, school accountability indicators, and subgroup performance are often available on a state website. But making data available is not the same as making it understandable. And making it understandable is not the same as making it useful.
In Cognia’s recent white paper, The Future of Assessment Is Coherence, we argue that the next generation of assessment and accountability should not be defined simply by new assessments, indicators, or accountability models. It must connect what students are expected to learn, what schools teach, what assessments measure, how results are reported, and how states and districts support continuous improvement.
Public reporting is critical to that ecosystem. As states redesign accountability systems, they should ask: Will educators, families, and communities understand what the data means and what happens as a result?
A state report card website should not simply report accountability. It should help people understand it and use the information for meaningful change.
Reporting Is Part of the Accountability System
Too often, public reporting is treated as the final step in accountability. States calculate indicators, make determinations, and publish required data satisfying state and federal requirements.
But publication of the data should not be the end of the story.
The Data Quality Campaign (DQC) emphasizes that transparency requires more than making information public. People must understand what the information means, why it matters, and how to use it. Transcend’s recent work on the future of state assessment similarly emphasizes preserving transparency, comparability, and public trust as states pursue greater flexibility and innovation.
The central question should not simply be “What are we required to report?” It should be, “What do people need to understand?”
Different Audiences Need Different Entry Points
Parents, educators, policymakers, and community members approach school report cards with different questions.
Parents may want to know whether their children are on track or how schools compare. Educators need patterns in achievement, growth, attendance, and student-group performance to inform instructional decisions. Community leaders may want to understand whether investments are improving outcomes and where additional support is needed.
Learning Heroes’ research with Gallup illustrates why this matters. Nine in 10 parents surveyed believed their children were performing at or above grade level in reading and math, despite national achievement data showing substantially lower performance. When parents understand their children may be behind, they are more likely to prioritize academic support and take action.
When parents understand their children may be behind, they are more likely to prioritize academic support and take action.
Information empowers people only when they understand it.
One dense table of accountability indicators cannot effectively serve every audience. The answer is not less transparency. It is better reporting architecture: accessible explanations, meaningful visualizations, appropriate context, and opportunities to explore data more deeply.
Coherence does not require identical presentations. It requires different audiences to encounter a consistent, trustworthy story about student and school performance.
Reporting Must Connect Accountability to Improvement
A school rating, index score, or identification label communicates something about performance, but rarely explains why results occurred, what happens next, or how improvement will be supported.
States risk perpetuating fragmentation when they design accountability indicators, school identification, public reporting, and then determine the supports schools will receive.
CCSSO’s 2026 Bridging Accountability and School Improvement Road Map offers a different approach: aligning accountability and improvement structures, processes, and supports around shared priorities for student success. Accountability should not operate as one system that identifies schools while another system, often with different measures, terminology, timelines, and expectations, attempts to help them improve.
If the future of accountability is coherence, states must design these functions together.
What outcomes matter? What evidence demonstrates progress? How will results inform accountability and improvement priorities? What supports will schools receive? How will we determine whether strategies are working?
Effective reporting should help stakeholders move through four connected questions:
What happened? → What does it mean? → What are we doing about it? → Is it working?
This is a fundamentally different vision for public reporting. The accountability report card then becomes more than a scorecard. It becomes an entry point into continuous improvement.
Start With People, Not the Website
One of the most important lessons I learned working on accountability systems, first at the state level and now with education leaders across the country, is simple: Engage the people who will use the information before deciding how to report it.
I saw this firsthand in the District of Columbia. During development of the DC School Report Card, families, educators, advocates, and community members helped determine what information should be included and how it should be presented. More than 4,000 responses informed development, and community organizations received tools to conduct their own engagement. DC continued seeking stakeholder input as the system evolved. The result involved incorporating new information and features while maintaining public data files and technical documentation for users.
Kentucky’s United We Learn initiative similarly demonstrates the value of engagement in accountability redesign. Statewide listening opportunities and participation from families, students, educators, business leaders, and communities helped shape the work, while Local Laboratories of Learning enabled districts to test approaches before broader implementation.
Communication must also extend beyond the state website. Texas, for example, is one of several states that provide resources to help local leaders explain accountability results to their communities.
Asking stakeholders to react to a nearly completed system is not the same as engaging them in defining what that system should accomplish.
These examples illustrate a fundamental shift in mindset. Stakeholder engagement should not be a box checked near the end of system development. Asking stakeholders to react to a nearly completed system is not the same as engaging them in defining what that system should accomplish.
This is more than good communications practice. It is good accountability design.
A Cycle for Coherent Public Reporting
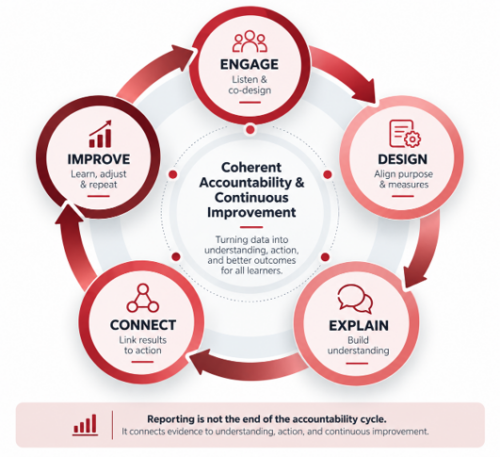
Engage. Involve families, educators, students, policymakers, and communities from the beginning. Define the system’s purpose and the questions different audiences need answered.
Design. Align state priorities, accountability measures, reporting, and school improvement supports. Co-design reporting alongside accountability, not after it.
Explain. Build data literacy into the system. Use accessible language, meaningful visualizations, context, professional learning, and family resources. Never assume stakeholders understand the terminology for proficiency, growth, or accountability.
Connect. Link results to action. Help users see how results relate to improvement priorities, available supports, strategies underway, and evidence of progress. Help stakeholders understand what happens next.
Improve. A technically accurate dashboard can still fail. Regularly test whether people can find, understand, and use the information. Examine how users actually use the system, identify barriers, refine the system, and repeat the cycle.
From Data to Understanding to Action
Assessment generates evidence of learning. Accountability identifies progress and need. Public reporting makes evidence visible and understandable. School improvement systems support action. Continuous improvement determines whether those responses are working.
When these functions operate separately, we can produce more data without more understanding and more accountability without better conditions for improvement. When these functions operate coherently, data becomes a shared source of information that supports conversations, decisions, accountability, and action.
When these functions operate coherently, data becomes a shared source of information that supports conversations, decisions, accountability, and action.
For states redesigning accountability, don’t begin with a formula, dashboard, or reporting template. Begin with people. Engage stakeholders before the system is designed. Then connect assessment, accountability, reporting, and improvement rather than leaving educators and communities to make those connections themselves.
Engage. Design. Explain. Connect. Improve. Then begin again.
Technology will change. Assessments will evolve. Accountability models will be reconsidered. But the fundamental responsibility of the system remains: Can people find the information they need, understand what it means, and use it to improve outcomes for students?
If the answer is no, publishing the data was only the beginning.
If the answer is yes, public reporting becomes something far more powerful: it becomes an essential part of a coherent ecosystem of continuous improvement.
References
Council of Chief State School Officers. (2026). Bridging Accountability and School Improvement. CCSSO. https://learning.ccsso.org/bridging-accountability-and-school-improvement
Felton, M. (2025). Community Engagement is Crucial for State Data Efforts. Data Quality Campaign. https://dataqualitycampaign.org/resource/community-engagement-is-crucial-for-state-data-efforts/
Gallup and Learning Heroes. (2026). B-flation: How Good Grades Can Sideline Parents. Gallup.com. https://www.gallup.com/analytics/513881/parents-perspectives-on-grades.aspx
Kentucky Department of Education. (2026). Timeline of United We Learn. ky.gov. https://www.education.ky.gov/UnitedWeLearn/Pages/Timeline%20of%20United%20We%20Learn.aspx
Nitkin, D., Gist, D., & Colwell, L. (2026, April 20). A Bridge to the Future of State Assessment. transcendeducation.org. https://transcendeducation.org/a-bridge-to-the-future-of-state-assessment/
Office of the State Superintendent of Education. (2026). DC School Report Card Frequently Asked Questions for Educators. https://osse.dc.gov/. https://osse.dc.gov/page/dc-school-report-card-frequently-asked-questions-educators

© Cognia Inc.
This article may be republished or reproduced in accordance with The Source Copyright Policy.
The information in this article is given to the reader with the understanding that neither the author nor Cognia is in engaged in rendering any legal or business advice to the user or general public. The views, thoughts, and opinions expressed in this article belong solely to the author(s), and do not necessarily reflect the official policy or position of Cognia, the author’s employer, organization, or other group or individual.
